SEACrowd · AI Singapore · SCB DataX, SCBX Group · Chulalongkorn University · VISTEC · University of Indonesia · Cohere
† The first five authors contributed equally.
TL;DR
SEATauBench adapts τ²-bench to Thai, Vietnamese,
Indonesian, Mandarin Chinese, and Filipino across Airline, Retail,
and Telecom. Four settings separate dialogue, tool understanding,
and domain reasoning while keeping the underlying tasks and scoring
aligned.
Multilingual language models can hold a conversation, but can they
complete a customer-service task when the tools, policies, and data
also change language? Agent capabilities in Southeast Asian languages
remain poorly understood, and English-only evaluation gives an
incomplete picture.
Three ideas SeaTauBench brings together
Aligned tasks across languages. Evaluate the same
customer-service tasks in Vietnamese, Thai, Indonesian, Mandarin
Chinese, and Filipino, with English as the reference.
Separate the language surfaces. Change dialogue,
tool specifications, or the full domain context to examine where
performance changes.
Measure success and consistency. Report task
success alongside performance across repeated trials, so a single
successful run does not tell the whole story.
Four settings isolate different language surfaces.
S1 is the English reference; S2 localizes dialogue, S3 tool schemas,
and S4 the full environment. Each row is a separate condition.
Which surfaces are localized in each setting?
Setting
Dialogue
Tool schemas
DB & policy
S1 · EnglishThe reference environment
English
English
English
S2 · InteractionChange the conversation
L2
English
English
S3 · ToolsChange the tool interface
English
L2
English
S4 · Full domainChange the full environment
L2
L2
L2
L2 is Vietnamese, Thai, Indonesian, Mandarin Chinese, or Filipino.
S3 keeps dialogue in English.
The same customer request can expose different language
demands. The example below follows a retail hat exchange
through an English environment and a fully localized Thai
environment. Compare the conversation
and tool responses to see which surfaces change; the accompanying
scores summarize benchmark conditions, rather than the outcome of
this single illustrated exchange.
LOCALIZATION IN PRACTICE
One task. Two language environments.
S1
English benchmark settings
Agent instruction EN
You are a helpful agent...
Customer request
I want to change the color of my ordered hat
ToolsEN
get_order_details[SC250526]"""Get the status and details of an order...
Figure 1. The same task, seen through different language environments. Illustrative task dialogue from the paper; accompanying scores summarize benchmark conditions, rather than the outcome of this single illustrated exchange. Original paper figure ↗
How we create SeaTauBench
The adaptation pipeline separates what the agent sees from what the
benchmark executes. Offline translation adapts the language while
preserving identifiers and executable structure; runtime mappings
connect localized tool arguments and responses to canonical values.
Automated checks and native-speaker review then assess preservation
and translation quality, with approved corrections recorded in a
separate reviewed release.
01 / TRANSLATE
Protect what must stay exact
A glossary guides offline translation. Identifiers, executable
tokens, and structure are preserved across task descriptions,
policies, schemas, and databases.
02 / EXECUTE
Keep actions aligned
Runtime mappings normalize localized tool arguments for
execution and localize returned content. Scoring compares
canonical outcomes.
03 / AUDIT
Review language and behavior
Automated preservation checks and native-speaker review assess
translation quality. Approved corrections are recorded in a
separate reviewed release.
Localization must preserve the task the agent is asked to
complete.
Results
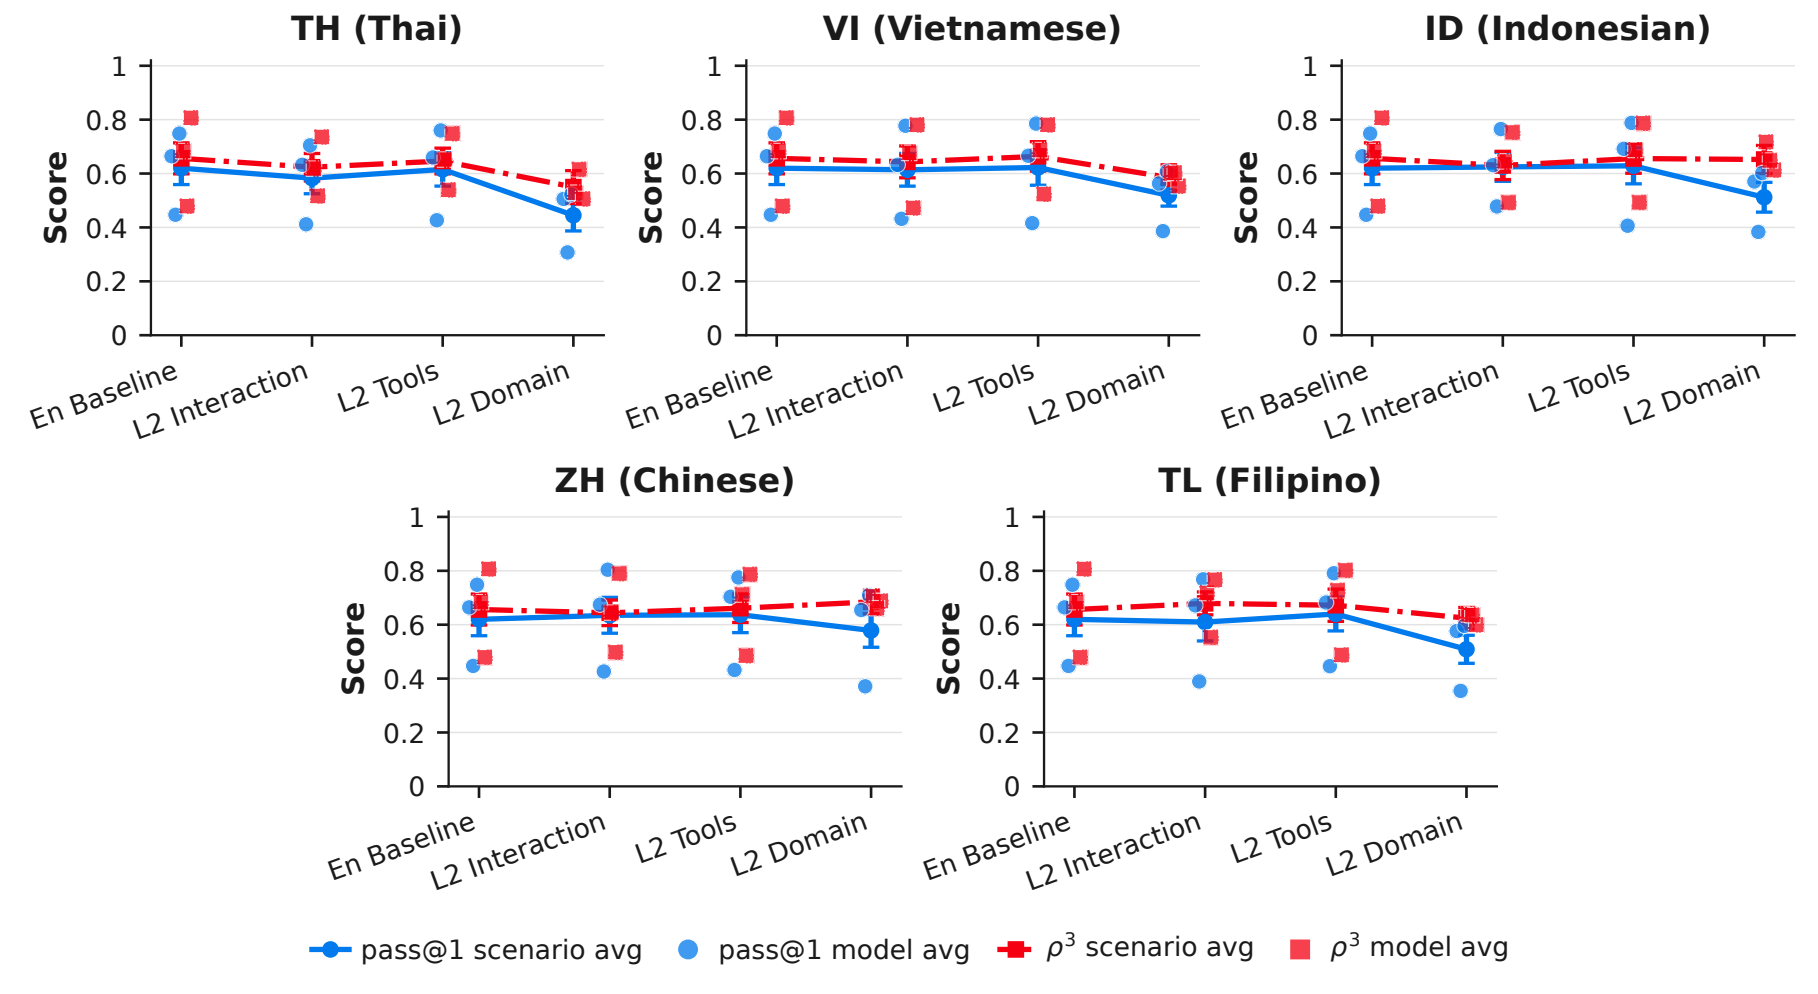
Task success falls as the environment is localized
Changing the conversation language alone preserves much of
the English performance, while full localization exposes a larger
task-success gap. The five panels below compare Thai,
Vietnamese, Indonesian, Chinese, and Filipino across S1 (English
baseline), S2 (L2 interaction), S3 (L2 tools), and S4 (L2 domain).
Blue circles show mean task success (pass@1), and red squares show
repeated-run robustness (ρ³); the connected series summarize each
setting, while the individual points show model averages.
Figure 3. Task success (pass@1) and repeated-run robustness (ρ³)
across localization settings and languages, from the paper.
View full size ↗
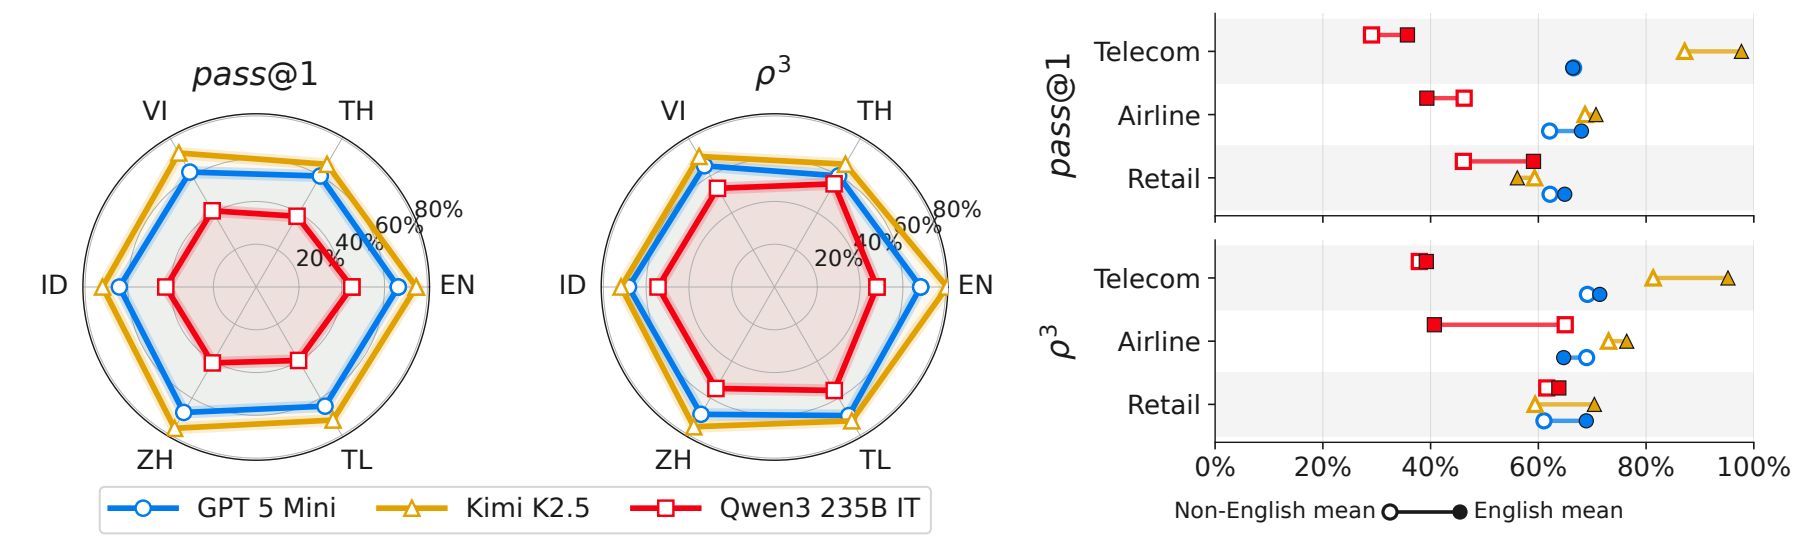
Task success and robustness reveal different aspects of
multilingual performance. In the plot below, the radar
charts compare pass@1 and ρ³ across English and the five target
languages, while the domain panels compare English and non-English
means for Airline, Retail, and Telecom. pass@1 measures mean task
success; ρ³ relates success across three trials to pass@1, so higher
robustness does not by itself mean that more tasks are solved.
The gaps vary by model, language, and domain, showing why English
results alone give an incomplete picture.
Figure 4. The paper’s model and domain comparisons. Explore the
appendix values in the leaderboard below.
Leaderboard
Paper v2 snapshot05 September 2026
Explore success and consistency under the same evaluation
conditions. The leaderboard starts with S4, the fully
localized setting, across all five target languages and three
domains; use the filters to compare other selections. Each score is
an equal-weight average of the selected language × domain cells:
pass@1 measures mean task success, while pass² and pass³ measure
success in all two or three trials, respectively. ρ³ is pass³
divided by pass@1 within each published cell and then averaged
separately, so ranking by consistency can produce a different
leader from ranking by success.
SEATauBench model ranking, macro-averaged over the selected
published results
Rank
Model
pass@1
pass²
pass³
ρ³
01
Kimi-K2.515 published results
60.9%
46.6%
37.7%
59.6%
02
GPT-5-mini15 published results
56.9%
43.3%
36.3%
62.3%
03
Qwen3-235B15 published results
35.9%
27.7%
23.8%
62.9%
Equal-weight macro-average over selected
language × domain cells.
3 models · 45 published results · ranked by pass@1
Table 19 reports all three models for S3. The paper’s main-text
aggregate discussion describes two. This leaderboard uses the
explicit appendix values.
pass@1 mean task success ·
pass² / pass³ success across repeated trials ·
ρ³ consistency relative to pass@1.
Inspect the published results
(45 selected rows)
Look beneath the averages to see where performance
differs. Each row below reports one model, language, and
domain under the selected localization setting, with its published
success and consistency scores. These rows follow the leaderboard
filters, and the source links identify the paper table behind
each result.
Table 20 evaluates GPT-5-mini and Qwen3-235B with mixed-language
tool specifications. Mix-2 uses English + Thai; Mix-3 adds
Vietnamese; Mix-4 adds Indonesian; Mix-5 adds Chinese. These 24
results are separate from the main leaderboard and do not respond
to its filters. Compare mixtures within the same model and domain
to see how success and consistency vary as the tool interface
includes more languages; the mixture labels describe tool
specifications, rather than the conversation language.
All 24 published mixed-language results from Table 20
Success across repeated trialspass@1 is mean
task success. pass² and pass³ measure success across two and
three trials, respectively; they are not success on any one
attempt.
Consistency is a different questionρ³ = pass³ /
pass@1 for each published cell. We average reported ρ³ values
separately. High robustness can coexist with low overall task
success.
Source:
paper v2, Tables 17–19 and 21. Equal weight per language/domain cell, not per individual task.
Values retain the paper’s precision; ties at the displayed
precision share a rank. Qwen3-235B denotes
Qwen3-235B-A22B-Instruct-2507.
Scores describe the frozen experiment snapshot, not the later
reviewed translation release. S3’s appendix lists three models
although the main-text aggregate comparison describes two.
Rankings here are computed from the appendix cells and may differ
from rounded narrative summaries. The benchmark uses 50 Airline
tasks and 114 tasks each in Retail and Telecom, with three trials
per task. The user simulator is Qwen3-235B-A22B-Instruct;
natural-language assertions use GPT-4.1.
Download the complete source dataset.
Explore SeaTauBench
Pronounced “si-tau-bench,” like sitaw, the Filipino word
for string beans.